Data highlight
DECEMBER 15, 2018
Voter turnout was relatively high across North Dakota in 2018
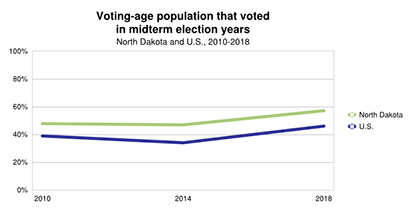 Historically, the voting-age turnout (those who are 18 years old and voted) in North Dakota has exceeded the national average. In the 2018 November election, 57 percent of the voting-age population in North Dakota turned out to vote, with 330,598 ballots casted. For comparison, voting-age turnout was 46 percent nationally. The 2018 voting-age turnout in North Dakota was higher than the previous two mid-term elections in 2010 (48%) and 2014 (47%).
The voting-age turnout rate increased in every North Dakota county when compared to the previous mid-term election in 2014. The voting-age turnout rate surpassed 60 percent in 34 counties and was more than 70 percent in six counties. The largest increase was reported in counties with Native American populations representing a majority. The turnout rate more than doubled in Sioux County, from 26 percent in 2014 to 53 percent in 2018. Similarly, the voter turnout rate in Rolette County rose from 33 percent to 53 percent, and in Benson County the rate increased from 33 percent to 51 percent.
Voting-age turnout is calculated by dividing the total number of voters (i.e., ballots cast) by the estimated voting-age population (i.e., age 18 and older).
VIEW TOPIC: CIVIC ENGAGEMENT / VOTER TURNOUT
DECEMBER 1, 2018
The educational attainment gap between North Dakota adults living above and below the poverty level shrunk in 2017 – with more adults below poverty now having at least a bachelor’s degree.
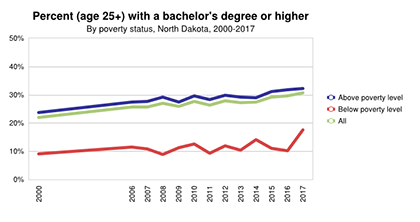 Since 2000, North Dakota’s percentage of adults (age 25 and older)holding a bachelor’s degree or higher has been slightly below the national average. In 2017, North Dakota ranked 26thamong the 50 states, with 30.7 percent of adults (age 25 and older) holding at least a bachelor’s degree (compared to 32% nationally).
However, while almost 1 in 3 adults (32.2%) who live above the poverty level held a bachelor’s degree or higher, nearly 1 in 5 adults (17.6%) below the poverty level had this education level. There has always been a gap in educational attainment by poverty status, but the gap shrank in 2017 as the percentage of adults below poverty that have a bachelor’s degree or higher increased from 10.1 percent in 2016 to 17.6 percent in 2017.
VIEW TOPIC: WORKFORCE / EDUCATIONAL ATTAINMENT
NOVEMBER 15, 2018
Percent of North Dakota young adults with a bachelor's degree or higher continues to push upward.
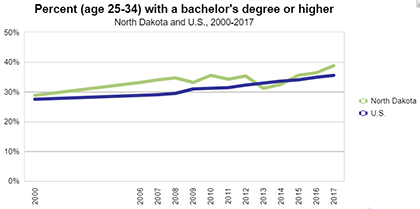 The modern world is increasingly producing high-skilled jobs. North Dakota's ability to compete with workers and economies worldwide is dependent on having a highly educated and skilled workforce - in both technical skills and intangible abilities, such as innovation and problem-solving. With 38.9 percent of adults age 25 to 34 holding a bachelor’s degree or higher, in 2017, North Dakota ranked 13th in the nation (rank of 1= highest percent) in terms of educational attainment. Massachusetts ranked first at 52.0 percent and Mississippi ranked last at 21.9 percent. Since 2000, North Dakota increased educational attainment of young adults age 25 to 34 by 10.1 percentage points. And since the rate declined in 2013, the educational attainment rate recovered and increased 7.6 percentage points.
It is important to continue to increase the level of education of the young generation, as a better educated workforce fuels the economic engine for states and communities and generally produces higher incomes and greater economic security. By improving the level of their own education, North Dakota residents can prepare themselves, their community, and their state for a brighter future.
VIEW TOPIC: WORKFORCE/EDUCATIONAL ATTAINMENT
NOVEMBER 1, 2018
Students living off campus impact the poverty rate for North Dakota’s college cities.
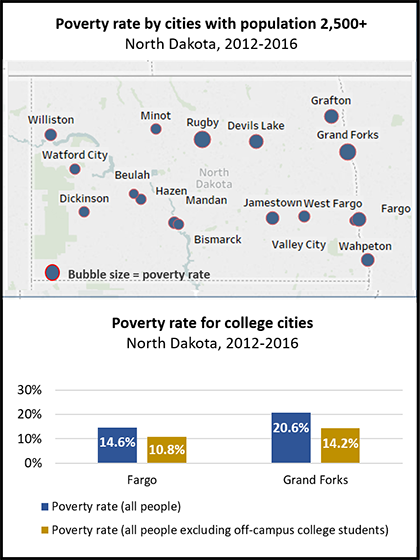 The poverty rate differs greatly among North Dakota’s largest cities (with population 2,500 and larger). According to American Community Survey (ACS) five year data (2012-2016), out of 17 cities, West Fargo ranked first with the lowest poverty rate at 6.8 percent, followed by Beulah (7.4%) and Dickinson (7.7%). On the other end of the spectrum, Grand Forks ranked second to last at 16 with a poverty rate of 20.6 percent and Rugby ranked last, with 21.1 percent of its population being in poverty. Fargo ranked 13 with a poverty rate of 14.6 percent.
Two of the North Dakota cities, Fargo and Grand Forks, are home to the two largest universities in North Dakota (North Dakota State University and University of North Dakota) which enroll about 14,000 students per year, each. According to a study conducted by researchers at the U.S. Census Bureau*, the poverty rate for these two cities is significantly impacted by the number of students living within the community, especially the number of students that live off campus (i.e., not with family or in student dorms).
Students living off campus represent 8.6 percent of the city of Fargo’s population and 11.6 percent of the city of Grand Forks population. While students reside only temporarily in the cities they go to school, their demographic and economic characteristics impact the communities they live in.Therefore, when excluding the off-campus students from the calculation, the poverty rate for Fargo dropped 3.8 percentage points from 14.6 percent to 10.8 percent and the Grant Forks poverty rate dropped 6.8 percentage points from 20.6 percent to 14.2 percent. While after this recalculation the poverty rates in Fargo and Grant Forks seem to “improve”, the cities’ poverty rates still fall in the bottom half of the ranking. However, taking this difference of calculation into consideration may help local planners and organizations when designing programs to reduce poverty.
Note: How is the poverty rate calculated? The U.S. Census Bureau estimates the poverty rates based on the cash income of the family. For families (those related by birth, marriage or adoption), cash income is summed across all family members and compared to a threshold that depends on the number of adults and children in the family. If a family’s total income is less than the applicable threshold, then that family and every individual in it are classified as in poverty. Poverty status is determined for all people except those living in institutional group quarters, military barracks, college dormitories, and children under 15 years of age not related to the householder by birth, marriage, or adoption. While students living on-campus and with family members are not included in the universe for which the poverty status is calculated, students living off campus are included in these estimates.
OCTOBER 15, 2018
North Dakota surpassed all other states with the largest increase in median household income when compared to a decade ago.
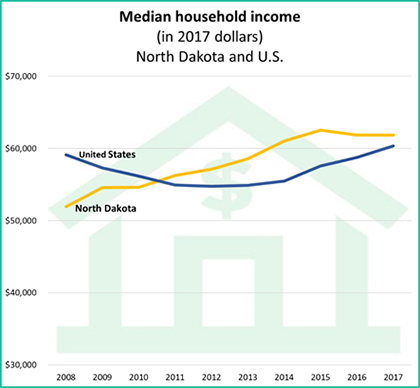 A household's income is calculated by combining the income of every resident over the age of 15 in that household. The median, or midpoint, income for all households is a measure of standard of living. After adjusting for inflation, examining the median income over time can explain whether economic conditions are improving or declining.
North Dakota’s household incomes have risen substantially since 2008 when the oil boom started. In 2008, the median household income in North Dakota was $51,923 (in 2017 inflation adjusted dollars) which was the 12th lowest median household income in the U.S. In 2011, the median household income in North Dakota exceeded the U.S. household income for the first time and has trended above national levels ever since. North Dakota’s median household income peaked in 2015 at $62,524 (2017 dollars), bringing North Dakota closer to the top of the rankings for median household income at 16th place in the nation. After a slight decrease in 2016, the median household income was $61,843 in 2017, still higher than the national median household income of $60,336, and ranking North Dakota 18th among the 50 states. Compared to 2008, North Dakota’s median household income in 2017 increased 19 percent, far greater than any other state in the nation during that time period.
It’s important to note that changes in median household income are not merely the result of the state of the economy, it also reflects changes in household characteristics, such as the size and composition of households, the employment status, and the educational attainment levels of household members, among others.
VIEW TOPIC: ECONOMY/ MEDIAN INCOME
OCTOBER 1, 2018
North Dakota ranks first in the nation for the share of cost-burdened households, but the burden increases as household income lowers .
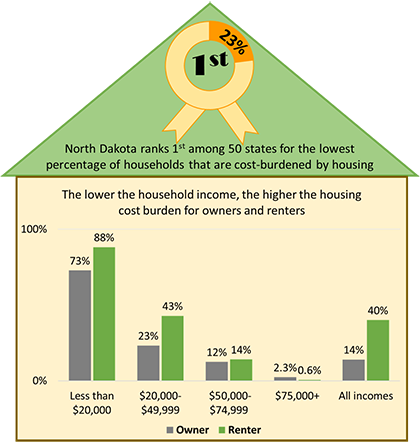 In 2017, North Dakota maintained first place among 50 states for the share of cost-burdened households, with 23 percent of households paying more than 30% of their gross income for housing. For comparison, the U.S. average is 32 percent and New York (39%), Hawaii (40%) and California (42%) are the states with the highest percentage of housing cost-burdened households.
While both homeowners and renters can face housing affordability issues, renters are more likely to be cost-burdened (14% of homeowners and 40% of renters in 2017, overall). One of the reasons is that renters in general have lower household incomes than homeowners. In North Dakota, in 2017, 25 percent of renters had household incomes lower than $20,000 as compared to 8 percent of homeowners. Similarly in 2017, 37 percent of renters had incomes in the $20,000 to $49,999 range as compared to 20 percent of homeowners in North Dakota.
The lower the household income, the higher the housing cost burden for renters and homeowners alike. When incomes are extremely low, the majority of both renters and homeowners experience housing cost burdens (73% of owners and 88% of renters for households with incomes lower than $20,000, in North Dakota in 2017). Similarly, for those North Dakota households with incomes between $20,000 and $49,999, nearly one-fourth of owner and nearly half of renter households are housing cost-burdened (23% and 43%, respectively).
It is important to pay attention to these issues since individuals and families whose housing costs exceed their threshold of affordability are likely to struggle to pay for other basic needs, forcing difficult trade-offs. They may have to make decisions that may result in poorer outcomes in other areas of well-being, such as dropping health care coverage or skipping meals to save on costs.
VIEW TOPIC: HOUSING / COST-BURDENED HOUSEHOLDS
SEPTEMBER 15, 2018
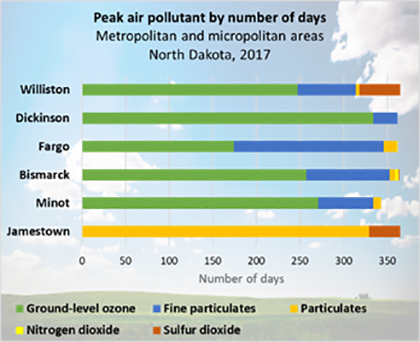
Ground-level ozone was the peak air pollutant for most metropolitan and micropolitan areas in North Dakota in 2017.
 Air is indispensable for our lives but unfortunately can contain substances that are unhealthy for us to breathe. Poor air quality is associated with increased risk of asthma, lung disease, and heart disease. Air pollutants can also cause damage to lake ecosystems, crops, and our climate.
The Air Quality Index (AQI) is an indicator of overall air quality. The Environment Protection Agency (EPA) calculates the AQI for five major air pollutants regulated by the Clean Air Act: ground-level ozone, particle pollution (also known as particulate matter), sulfur dioxide, nitrogen dioxide, and carbon monoxide. Air quality is measured by monitors that record the concentrations of the major pollutants each day. A daily index value is calculated for each air pollutant measured. The highest of those index values is the AQI value, and the pollutant responsible for the highest index value is the "peak pollutant."
Ground-level ozone, different than the one found in the upper atmosphere, is created by chemical reactions between pollutants emitted by cars, industrial facilities, and electric utilities in the presence of sunlight. In 2017, ground-level ozone was the peak air pollutant for most days of the year for five of the six metropolitan and micropolitan areas with air quality monitors. For the Dickinson micropolitan area (Stark county), ground-level ozone was the main pollutant for the majority of days in 2017 (334 of the 365 days). In the Minot micropolitan area (McHenry, Renville, and Ward counties), ground-level ozone was the peak pollutant for about three-fourths of the year (271 days) in 2017. The Bismarck metropolitan area (Burleigh, Morton, Oliver and Sioux counties) and the Williston micropolitan area (Williams County) also had ground-level ozone as peak pollutant for nearly three-fourths of the year in 2017 (257 days and 247 days, respectively). The Fargo metropolitan area (Cass County, ND and Clay County, MN) had ground-level ozone as peak pollutant for nearly half the year in 2017 (174 days).
Particle pollution (particulates and fine particulates) is due to a mixture of inhalable solid particles and liquid droplets found in air, which are formed as a result of reactions between pollutants. If inhaled, these particles can affect the heart and lungs, in addition to causing other significant health issues. In 2017, particulates were the peak pollutant for most days of the year in the Jamestown micropolitan area (Stutsman County) (329 days). Very fine particles (fine particulates) were the peak pollutant in the Fargo metropolitan area for nearly half of the year (172 days) and in the Bismarck metropolitan area for about one-fourth of the year (96 days) in 2017.
Other pollutants include sulfur dioxide, which are generated by fossil fuel combustion at power plants and other industrial facilities, and nitrogen dioxide, which forms from emissions from cars, power plants, and off-road equipment. Sulfur dioxide was the peak pollutant in Williston micropolitan area for 47 days and in Jamestown micropolitan area for 36 days in 2017. Nitrogen dioxide was peak pollutant for only a few days in the Bismarck and Fargo metropolitan areas in 2017.
VIEW TOPIC: ENVIRONMENT / AIR QUALITY
SEPTEMBER 1, 2018
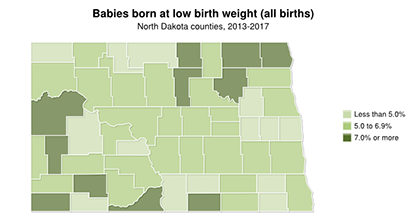
The percentage of low birth weight babies in North Dakota varies greatly by county
 A baby's birth weight indicates both the mother's health and nutritional status, and her baby's chances for growth, overall development, and long-term health. A healthy birth weight is considered at least 5 pounds, 8 ounces (or at least 2,500 grams). Babies born at less than this weight are considered low birth weight.
Statewide, low birth-weight babies represented 6.7 percent of all live births in 2017. While the overall percentage of low birth weight babies in North Dakota has trended lower than the U.S. since 1990, it varies greatly by county. At the county level, a five-year time period is used in order to protect the confidentiality of small number of births. For the 2013-2017 period, Adams County ranked first among counties with the lowest rate of babies born with a low weight at 1.7 percent. Renville (2.6%), Divide (2.9%) and Nelson (3.4%) counties are also listed with less than 4 percent of low birth weight babies for the same time period. In contrast, four counties had a low birth rate higher than 8 percent (i.e., Rolette 8.2%, Ramsey 9.2%, Cavalier 9.6%, and Pierce 14.0%).
There are multiple factors that could explain the differences in low birth weight rates. Multiple births are at increased risk for low birth weight. Statewide, more than half of multiple births are low birth weight (53.3%). Other risk factors for low birth weight include the mother’s race and age. In North Dakota 6.0 percent of births to white mothers were low birth weight as compared to 8.1 percent to American Indian mothers and 9.4 percent to mothers of other races. In addition, very young mothers are at more risk of having a baby with low birthweight (10.3% for mothers younger than age 20 compared to 6.6% for mothers ages 20 and older).
Low birth weight carries a range of health risks, including a weakened immune system, reduced muscle strength, decreased cognitive and social development, and a higher incidence of diabetes and heart disease in later life. Low birth weight babies have an increased risk of disease and even of death during their early months and years. Mothers can significantly reduce the risk of having low birth weight babies if they maintain good nutrition and proper prenatal care throughout their pregnancy.
Note:
Births are assigned to the home residence of the mother, regardless of where the birth took place.
County numbers are based on data collected over 5-year time periods, and therefore refer to aggregate counts and overall percentages of babies born at low birth weight over a 5-year time period.
VIEW TOPIC: EARLY CHILDHOOD/LOW BIRTH WEIGHT
AUGUST 15, 2018
Jobs in industries closely tied to the oil and gas sector followed similar patterns of growth and decline in North Dakota
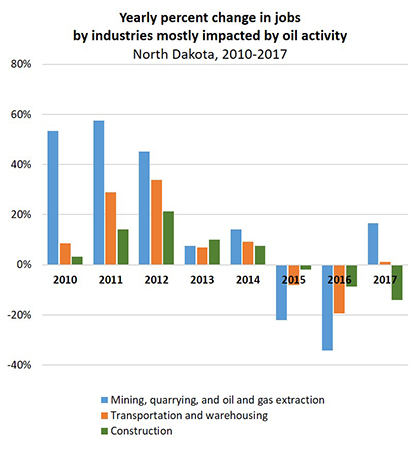 The number of jobs in North Dakota have been strongly impacted by the economic fluctuations during the past decade. The rapid economic growth during the oil boom drove an increase in population and employment especially in the Western part of the state. Similarly, the recent economic downturn due to low oil prices also impacted the number of jobs, especially for the industries closely tied with the oil and gas sector.
The Mining, quarrying, and oil and gas extraction industry experienced tremendous growth in the number of jobs at the beginning of the oil boom period (53% from 2009 to 2010, 58% from 2010 to 2011, and 45% from 2011 to 2012). While the growth slowed down, the industry continued to add jobs in 2013 and 2014, reaching almost 30,000 jobs in 2014. However, due to low oil prices and the decline in oil and gas production, the industry lost 22 percent of jobs in 2015 and 34 percent in 2016. Even with this decrease, the number of jobs in 2016 was still 44 percent higher than in 2010 and 360 percent higher than in 2000. With the oil prices on the rise, recently the industry added 2,538 jobs in 2017, a 17 percent increase from the previous year.
Other industries closely tied to the oil and gas sector followed similar patterns of growth and decline in the number of jobs. Transportation is crucial for the mining industry as most materials and final products are transported by truck. Therefore, the number of jobs in the Transportation and warehousing industry follows the closest to the trends in the Mining, quarrying, and oil and gas extraction industry. After gaining jobs up until 2014 and losing jobs in 2015 and 2016, the industry added about 200 jobs in 2017.
The Construction industry is also closely tied with oil and gas economic activity in creating the infrastructure needed and in supporting the needs of a growing population in the area. The Construction industry followed the same trends of growth and decline in jobs from 2010 to 2016. However, unlike the Mining, quarrying, and oil and gas extraction and the Transportation and warehousing industries, the Construction industry continued to lose jobs in 2017, partly because some construction programs were completed, and partly because less funds were available for investment in a slower economy. Although the Construction industry lost over 4,000 jobs in 2017, the number of jobs in 2017 was still 26 percent higher than in 2010 and almost 70 percent higher as compared to 2000.
AUGUST 1, 2018
Increased diversity in North Dakota’s child population
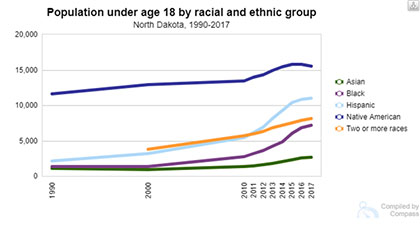 While North Dakota is less racially and ethnically diverse than most states (44th out of 50 states in 2017), minority populations are increasing at much larger rates than the state’s white non-Hispanic population, creating an increasingly more diverse state. Out of all age groups, children are the most racially and ethnically diverse.
The Native American children (ages 0 to 17) comprises the largest minority child population in North Dakota (9% in 2017). While increasing in number (from 13,457 in 2010 to 15,510 in 2017), the percentage of Native American children remained relatively unchanged from 2010 to 2017.
Comprising 10 percent of North Dakota's children in 2017, children identified as Black, Asian, and of two or more races almost doubled from 9,812 children in 2010 to 17,961 children in 2017. Among these racial groups, the Black child population experienced the largest increase from 2,780 in 2010 to 7,131 in 2017 (157% increase). The Asian child population doubled from 1,326 in 2010 to 2,692 in 2017, and those who are identified as two or more races increased by 43 percent (from 5,706 in 2010 to 8,138 in 2017).
Per US Census Bureau classification, Hispanic origin (also known as ethnicity) can be viewed as the heritage, nationality, lineage, or country of birth of the person or the person’s parents or ancestors before arriving in the United States. People who identify as Hispanic, Latino, or Spanish may be of any race. In North Dakota, the number of children who are ethnically Hispanic doubled from 5,403 in 2010 to 10,969 in 2017.
Race and ethnicity have important implications for the overall well-being of children. Children of different races and ethnicities often show large variation in health, mortality, school performance, and access to family and community resources.
VIEW TOPIC: CHILDREN & YOUTH/ POPULATION TRENDS
JULY 15, 2018
North Dakota’s counties experienced differential population change from 2016 to 2017
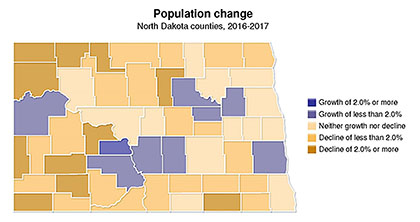 According to the 2017 U.S. Census Bureau’s Population Estimates, after years of continuous growth, North Dakota lost 155 people from 2016 to 2017. While most of the counties lost population in the past year, a few counties continued to grow. Cass County tops the population growth ranking with a gain of 3,162 people, followed by Burleigh (601), Grand Forks (199), Morton (181) and McKenzie (118). Oliver County leads the counties in percentage growth with a 2.2 percentage increase in population from 2016 to 2017, followed by Cass (1.8%) and Benson, Eddy, and Nelson (1.2%).
Out of the 53 counties, 34 lost population from 2016 to 2017. Ward led the counties in population decline with a loss of 1,207 people, followed by Williams (846), Stark (647), Barnes (195), and Mercer (172). Hettinger led the counties in percentage decline, with a 4.5 percentage loss. Burke and Divide also lost over 4 percent of their population from 2016 to 2017 (4.3% and 4.2%, respectively).
Although the overall trend is a slight decline in population in all areas of the state with the largest declines in the west, most metropolitan counties remained strong and saw an increase in population.
VIEW TOPIC: DEMOGRAPHICS / POPULATION
JULY 1, 2018
The age structure in North Dakota is changing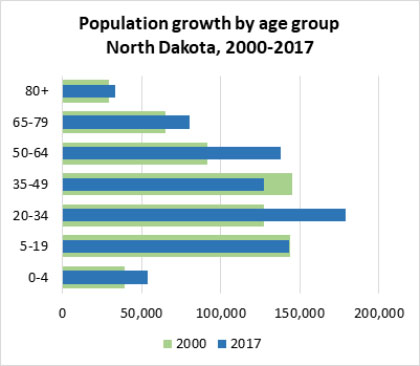 Understanding the distribution of various age groups in a population is important for community development. For instance, a top-heavy age distribution (i.e., an older population) in a community suggests an aging of the population, which may cause implications for economic development, workforce, and service programming. A bottom-heavy distribution (i.e., much younger population) suggests potential for growth, but also an increased need for jobs, housing, childcare, and education.
Due to two main trends in North Dakota, both the bottom and the top of the age distribution saw changes from 2000 to 2017. The bottom half of the age distribution saw an increase in the number of young children (0 to 4 years old) and an increase in the number of young adults (20 to 34 years old). The 0 to 4 age group increased by 37 percent from 39,400 in 2000 to 54,043 in 2017. The 20 to 34 years old population saw a 41 percent increase from 127,390 in 2000 to 179,144 in 2017. This change was influenced by an increase in the number of births coupled with an influx of young people to the state due to North Dakota’s energy development.
The aging of the baby boom generation, those born from 1946 to 1964, influenced the top of the age distribution, with an increase of population age 50 and older. Specifically, the 50-64 year olds grew by 51 percent, from 91,428 in 2000 to 138,139 in 2017.
These changes bring both opportunities and challenges which could have consequences for the society and the economy. Understanding the age structure of a community is essential to plan for services like schools, housing, healthcare, and transportation.
VIEW TOPIC: DEMOGRAPHICS/AGE
June 15, 2018
A larger proportion of the foreign born population lacks health insurance compared to the native born population in North Dakota.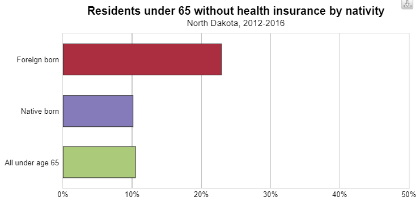 In the U.S. health insurance is the best way to ensure access to health care. Uninsured individuals are less likely to receive preventive care or care for routine medical conditions and injuries. Lack of preventive health care and lack of treatment for medical conditions can lead to more serious illnesses and health problems. This in turn, can result in preventable hospitalizations and deaths. North Dakota ranks middle of the pack (21st lowest uninsured rate) among states in the U.S. with an uninsured rate of 8 percent, which is a slightly lower rate than the U.S. rate of 10 percent.
According to the American Community Survey 5-year estimates, in 2016, 24,364 foreign born people, those who were not U.S. citizens at birth, lived in North Dakota, of which 22,537 were younger than 65 years old. Nearly one in four North Dakota foreign born residents (younger than 65 years old) were uninsured (22.9%) in 2016, which equates to 4,967 foreign born residents. In comparison, one in 10 native born residents lacked health insurance (10.1% or 60,319 residents).
The lack of health care coverage affects everyone in a community. Those without health insurance feel the direct physical, mental, and financial effects of not having health care coverage, while the insured are affected indirectly through higher health care premiums and higher taxes.
Note: The foreign born population includes people who were not U.S. citizens at birth. It excludes people born in the United States, Puerto Rico, or U.S. Island Areas; as well as those born in a foreign country who had at least one parent who was a U.S. citizen.
Individuals without health insurance are those who, at the time of the survey, lacked comprehensive health coverage through: a current or former employer or union; insurance purchased directly from an insurance company; Medicare, Medicaid, Medical Assistance, or any kind of government-assistance plan for those with low incomes or a disability; TRICARE or other military health care; or VA (including those who have ever used or enrolled for VA health care). Note that coverage solely by the Indian Health Service (IHS) does NOT count as health insurance; i.e., people who were only covered by IHS in the previous year are counted as uninsured.
VIEW TOPIC: HEALTH/HEALTH CARE COVERAGE
June 1, 2018
Newly released GDP data indicate movement in the right direction for North Dakota’s economy.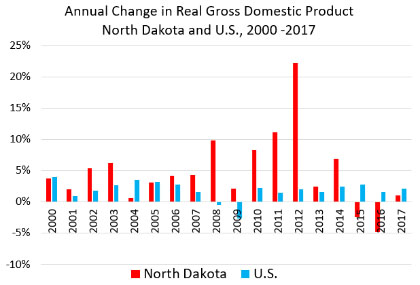 A strong economy can help revitalize communities, encourage business investment, and provide employment opportunities for a competitive workforce at all skill levels. A measure of economy is gross domestic product (GDP), which is the measure of the market value of all final goods and services produced by labor and property located in a specific region.
From 2000 to 2017 North Dakota ranked first among the 50 states with the fastest rate of real compound annual growth of GDP at 4.7 percent. Oregon ranked second with a growth rate of 2.9 percent. In addition, North Dakota’s economy is substantially larger than it was 10 years ago.
Despite this seemingly positive economic outlook, North Dakota’s economy was hit with decline in state revenues in 2015 and 2016 due to dropping commodity prices both in the oil and gas industry and agriculture, which contributed to negative annual changes in real GDP in both 2015 and 2016.
Newly released GDP data indicate movement in the right direction for North Dakota’s economy. In 2017, the annual change in real GDP increased by 1 percent from the previous year. This change is an improvement compared to the past two years when the annual change in real GDP decreased by 2.5 percent in 2015 and decreased by 4.9 percent in 2016.
Note: “Real” values are inflation-adjusted statistics—that is, they exclude the effects of price changes. The statistics of real GDP by state are prepared in chained (2009) dollars.
VIEW TOPIC:ECONOMY/ ECONOMIC OUTPUT (GDP)
May 15, 2018
Racial and ethnic diversity in North Dakota increased since 2010.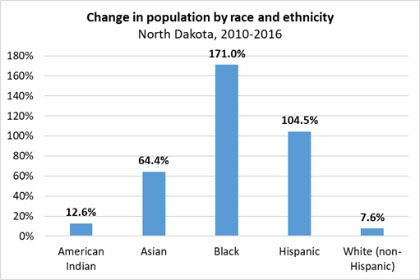 In 2016, North Dakota was the 7th least racially and ethnically diverse state in the U.S. with the population of color (i.e., non-White) accounting for 15 percent of the population. However, the North Dakota population of color (i.e., non-White) increased by more than half (53.5%) from 2010 to 2016, which equates to nearly 40,000 people.
Among the racial and ethnic groups in North Dakota, the Black population experienced the largest increase from 8,248 in 2010 to 22,356 in 2016 (171%). The Hispanic population doubled from 13,467 in 2010 to 27,538 in 2016 (104.5%), followed by the Asian population that increased by approximately 4,500 people, from 7,032 to 11,561, a 64 percentage increase.
The American Indian population, the largest minority population in North Dakota, increased by 13 percent from 2010 to 2016, from 36,948 to 41,596.
VIEW TOPIC:DEMOGRAPHICS/RACE
May 1, 2018
Disability rates in North Dakota were slightly higher for males than females in all age groups in 2016.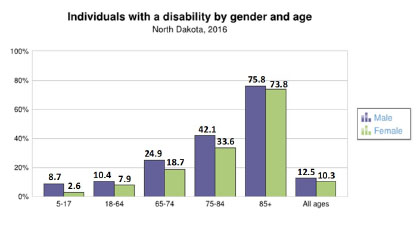 Disability is an overarching term and therefore hard to define. A variety of professionals and organizations use the term disability, but in a variety of contexts. Numerous disabilities can be identified as falling under the categories of health, physical, learning, psychological, and other cognitive impairments. Some people are born with a disability, while others develop them as they age or have them as a result of an injury or illness. People with disabilities may require interventions to remove environmental or social barriers. Disability does not imply an illness or the incapacity to learn, work, or perform a task.
In North Dakota, 12 percent of people were living with one or more disabilities in 2016. This percent is slightly lower than the national average (13%) and among the lowest among states (11th lowest percentage among the 50 states).
The percentage of people with disabilities increases with age, from 6 percent in the 5-17 age group to 75 percent in the population age 85 and older. By gender, the percentage of male with disabilities is slightly higher than the percentage of female with disabilities for all age groups, especially for children age 5 to 17 and older adults age 75 to 84.
By understanding the population with disabilities, community leaders can better align services to meet upcoming and/or current needs of the community.
VIEW TOPIC:DEMOGRAPHICS/ DISABILITY
April 15, 2018
Poverty rate in North Dakota is lower than the national average but varies greatly by county.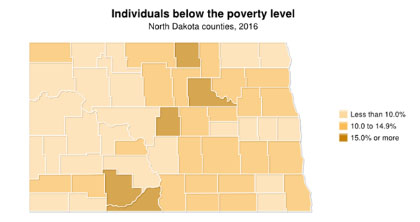 Poverty refers to a state in which an individual lacks the monetary resources to afford basic human needs, such as clean water, nutrition, health care, education, clothing, and/or shelter. The lack of these resources makes it difficult to reach a minimum standard of living or wellbeing deemed acceptable by society. The Census Bureau uses income thresholds, which vary by family size and composition, to determine who is in poverty. If a family's total income is less than the family's threshold, then that family and every individual in it is considered to be living in poverty. Income thresholds are updated annually by the U.S. Census Bureau.
The poverty rate in North Dakota in 2016 was 10.7 percent, down 2.4 percentage points from 13.1 percent in 2010, and lower than the national average of 14.0 percent. In 2016 North Dakota had the 10th lowest poverty rate among the 50 states.
While all but six counties in North Dakota had a poverty rate lower than the national average and more than half of the counties (32) had poverty rates lower than the state’s average, there are large differences in poverty rates among counties. The county with the lowest estimated poverty rate was Mercer at 6.6 percent. Other North Dakota counties with an estimated poverty rate under 8 percent include Williams, Burleigh, Sargent, and McKenzie. There are three counties, however, where more than one quarter of the population was below the poverty level in 2016: Rolette (26.7%), Benson (29.4%), and Sioux (35.3%).
Note:
In 2016, the federal poverty threshold for a household of two adults and two children was about $24,339.
April 1, 2018
Homeownership rate decreased for all income groups in North Dakota from 2000 to 2016.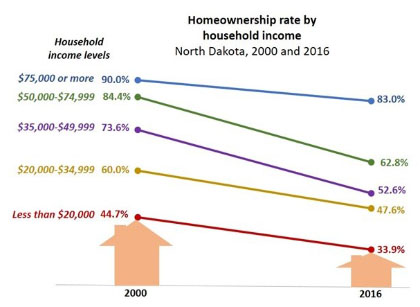 Homeownership has been a significant part of the American Dream. Owning a home provides an important source of stability for children and their families and is a measure of financial security. Communities also benefit from high rates of homeownership. Residents who own their homes, in general, feel more rooted, take greater pride in the appearance of their homes, and have greater positive involvement with the community. Access to homeownership is a factor of the availability of affordable housing inventory as well as household income levels.
While the overall homeownership rate in North Dakota slightly increased from 61.7 percent in 2015 to 63.2 percent in 2016, when compared to 2000, the homeownership rate saw a 3 percentage point decrease (from 66.6% to 63.2%). Changes in the homeownership rate are partially influenced by changes in demographic characteristics of the population such as age, race and ethnicity, education, family status, and income.
In general, higher household incomes increase the opportunity to own a home. While the median household income* increased in North Dakota from $49,850 in 1999 to $60,656 in 2016, the homeownership rate decreased for each income group from 2000 to 2016. The largest decreases in homeownership were for householders with a household income from $35,000 to $74,999. Changes in government policy and housing market conditions and demographic characteristics potentially contributed to the decline of the homeownership rate for each income category and the increasing income disparity gaps in the homeownership rate.
*Median household income is adjusted for the effects of inflation or deflation (i.e., in 2016 dollars).
VIEW TOPIC: HOUSING/HOMEOWNERSHIP RATE
March 15, 2018
Volunteer participation for Generation X - highest of all generations in North Dakota.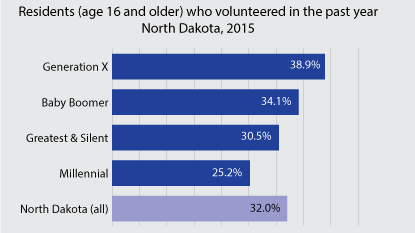 Volunteering is a form of civic engagement that brings significant benefits to individuals and communities. Volunteers are important community assets, helping to enrich the lives of those they serve and often providing care and services that neither government nor the private sector can afford to provide on their own.
Among the 50 states, North Dakota ranked 7th highest in volunteer participation of residents age 16 and older, at 32.0 percent in 2015. North Dakota’s volunteer rate was 7 percentage points higher than the U.S. rate of 24.9 percent in the same year.
Volunteerism differs among age groups. When looking at generations (i.e., people born and living at about the same time), volunteer participation for Generation X was the highest among all generations at 38.9 percent. Generation X’s rate was nearly 5 percentage points higher than the next highest rate among the generations (Baby Boomers 34.1%) and nearly 14 percentage points higher than the lowest rate among the generations (Millennials 25.2%).
Note: There are no official cutoff points defining the span of a generation; however, general cohort approximations include: Millennials (those born between 1982 and 1996); Generation X (those born between 1965 and 1982); Baby Boomers (those born between 1946 and 1964); and the Greatest and Silent generation (those born between 1928 and 1946).
VIEW TOPIC: CIVIC ENGAGEMENT / VOLUNTEERISM
March 1, 2018
The percentage of young children for whom all parents are working increased overall in North Dakota, but varies greatly among counties.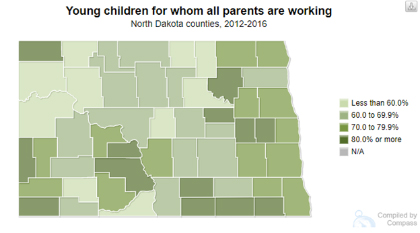
Parental employment is extremely important in regards to the future of a child. It is directly linked to increases in family income, a decrease in poverty, and a higher likelihood of children having access to health care. The percentage of young children (under 6 years old) for whom all parents are working increased in North Dakota from 66.1 percent in 2015 to 73.5 percent in 2016 and is higher than the national average at 65.5 percent.
However, parental employment varies greatly by county. Almost all young children in Griggs (98.7%) and Divide (95.5%) counties have all parents working, while less than 1 in 3 children (30.1%) in Sheridan County have all parents employed in the labor force.
When all parents in the household are working, access to quality child care, which influences children's overall development, becomes an important consideration and possible necessity for a family.
Note: All parents are working if both mother and father are employed in the labor force in married-couple families, or if a child's mother or father is employed in the labor force in single-parent families. Excluded from the employed are people whose only activity consisted of work around the house or unpaid volunteer work for religious, charitable, and similar organizations; also excluded are all institutionalized people and people on active duty in the United States Armed Forces.
VIEW TOPIC: EARLY CHILDHOOD/CHILDREN WITH WORKING PARENTS
FEBRUARY 15, 2018
Diabetes rates for those at most risk decreased in North Dakota in 2016.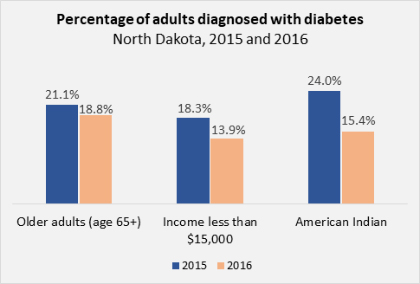
In North Dakota 8.6 percent of adults (age 18 and older) had diabetes in 2016. The diabetes rate for adults in North Dakota remained fairly constant since 2011 and was lower than the national average of 10.5 percent in 2016. However, population groups at highest risk for diabetes (i.e., older adults, people living in very low income households, and American Indian population) saw a decrease in the diabetes rates from 2015 to 2016.
In 2016, older adults (age 65 and older) had the highest diabetes rate at 18.8 percent followed progressively by lower rates for younger age groups. Although having the highest diabetes rate among all age groups, older adults in North Dakota experienced a decrease in the percentage of people with diabetes from 21.1 percent in 2015 to 18.8 percent in 2016. The diabetes rate remained fairly constant for most other age groups from 2015 to 2016.
The lower the household income, the higher the percentage of adults diagnosed with diabetes. However, the percentage of adults with the lowest incomes (incomes below $15,000) who have diagnosed diabetes decreased from 18.3 percent in 2015 to 13.9 percent in 2016.
American Indian adults are almost twice as likely to have been diagnosed with diabetes as non-Hispanic white adults (15.4% and 8.5%, respectively in 2016). Although higher, the percentage of American Indian adults diagnosed with diabetes decreased from 24.0 percent in 2015 to 15.4 percent in 2016.
FEBRUARY 1, 2018
North Dakota adults are attaining higher levels of education compared to 2000.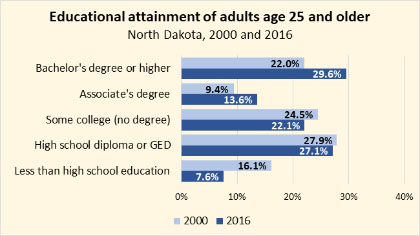
Educational attainment refers to the highest level of education completed (e.g., a high school diploma, a bachelor's degree, or a master's degree). In 2016, approximately 9 in 10 adults (age 25 and older) had at least a high school diploma or GED (92.4%), and nearly 1 in 3 of adults (29.6%) had a bachelor’s degree or higher. About 8 percent of adults had less than high school education.
When comparing to 2000, educational attainment increased in North Dakota. The percentage of adults with less than high school education decreased from 16.1 percent in 2000 to 7.6 percent in 2016 while the percentage of residents with an associate’s degree or higher increased during the same time period from 31.4 percent to 43.2 percent.
VIEW TOPIC:WORKFORCE/EDUCATIONAL ATTAINMENT
JANUARY 1, 2018
Recently released population estimates shows North Dakota’s population holds steady.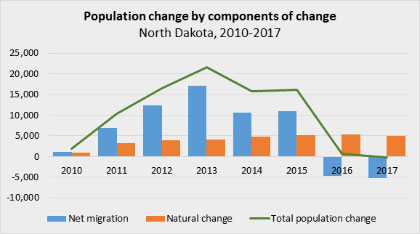
After years of continuous growth, North Dakota’s population remained relatively unchanged from 2015 to 2017 reaching a total of 755,393 residents in 2017. Although the population held steady over the last two years, North Dakota had a 12.3 percent growth from 2010 to 2017 which is the second fastest population growth of all states during this time period.
The modest population change over the past two years can be attributed to the stabilizing of the birth rates and also out-migration. Increasing since 2011, North Dakota’s birth rate started to level off in 2015 with the number of births slightly decreasing from 11,404 in 2015 to 11,282 in 2016, and 11,064 in 2017.
Over the past two years North Dakota experienced a larger number of people leaving than entering the state, a negative net migration of 4,684 residents in 2016 and 5,164 residents in 2017 which is in contrast to the previous years when North Dakota had more people entering than leaving the state (U.S. Census Bureau, 2017 Population and Housing Unit Estimates).
Note: Net migration = number of people who enter the state (in-migration) minus the number of people who leave the state (out-migration); Natural change = Number of births minus number of deaths; Total population change = Net migration + Natural change
VIEW TOPIC:DEMOGRAPHICS/POPULATION
Center for Social Research
North Dakota State University
Compass created by:
Wilder Research
© 2025. All rights reserved.